参考自:Bubble sheet multiple choice scanner and test grader using OMR, Python and OpenCV
一个简易的答题卡识别与分数判断小程序
修改说明:
1.不import imutils库,直接找mutils的源码,复制需要的函数的源码过来,分析算法原理
2.在jupter notebook中测试,可以方便地分阶段测试
引入必要的库
1
2
3
4
5
6
7
| import numpy as np
import cv2
import matplotlib
import matplotlib.pyplot as plt
%matplotlib inline
|
定义需要的函数
4边形4点排序函数
1
2
3
4
5
6
7
8
9
10
11
12
13
14
15
16
17
18
|
def order_points(pts):
rect = np.zeros((4, 2), dtype = "float32")
s = pts.sum(axis = 1)
rect[0] = pts[np.argmin(s)]
rect[2] = pts[np.argmax(s)]
diff = np.diff(pts, axis = 1)
rect[1] = pts[np.argmin(diff)]
rect[3] = pts[np.argmax(diff)]
return rect
|
4点变换函数
1
2
3
4
5
6
7
8
9
10
11
12
13
14
15
16
17
18
19
20
21
22
23
24
25
26
27
28
29
30
31
32
|
def four_point_transform(image, pts):
rect = order_points(pts)
(tl, tr, br, bl) = rect
widthA = np.sqrt(((br[0] - bl[0]) ** 2) + ((br[1] - bl[1]) ** 2))
widthB = np.sqrt(((tr[0] - tl[0]) ** 2) + ((tr[1] - tl[1]) ** 2))
maxWidth = max(int(widthA), int(widthB))
heightA = np.sqrt(((tr[0] - br[0]) ** 2) + ((tr[1] - br[1]) ** 2))
heightB = np.sqrt(((tl[0] - bl[0]) ** 2) + ((tl[1] - bl[1]) ** 2))
maxHeight = max(int(heightA), int(heightB))
dst = np.array([
[0, 0],
[maxWidth - 1, 0],
[maxWidth - 1, maxHeight - 1],
[0, maxHeight - 1]],
dtype = "float32")
M = cv2.getPerspectiveTransform(rect, dst)
warped = cv2.warpPerspective(image, M, (maxWidth, maxHeight))
return warped
|
轮廓排序函数
1
2
3
4
5
6
7
8
9
10
11
12
13
14
15
16
17
18
19
20
21
22
23
24
25
|
def sort_contours(cnts, method="left-to-right"):
reverse = False
i = 0
if method == "right-to-left" or method == "bottom-to-top":
reverse = True
if method == "top-to-bottom" or method == "bottom-to-top":
i = 1
boundingBoxes = [cv2.boundingRect(c) for c in cnts]
(cnts, boundingBoxes) = zip(*sorted(zip(cnts, boundingBoxes),key=lambda b: b[1][i], reverse=reverse))
return cnts, boundingBoxes
|
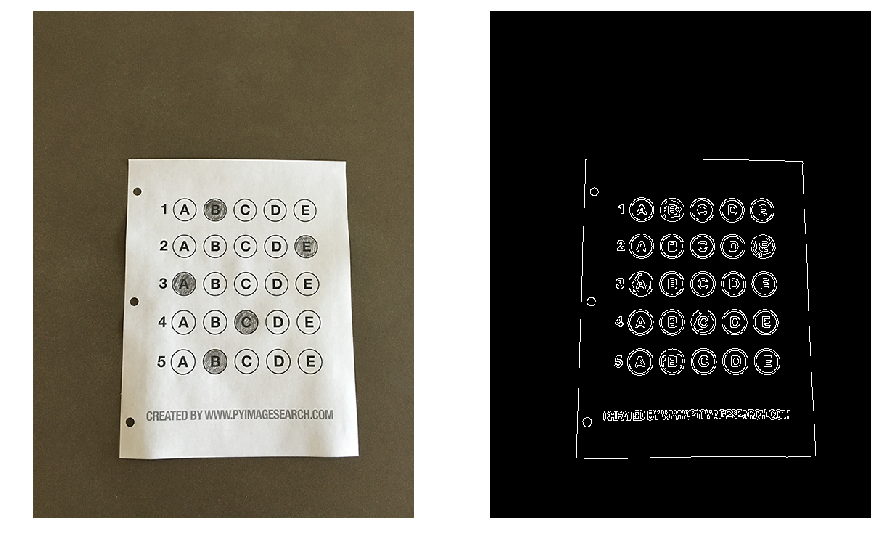
图像识别部分
读入图片+预处理
1
2
3
4
5
6
7
8
9
10
11
12
13
14
15
|
image = cv2.imread('omr_test_01.png')
gray = cv2.cvtColor(image, cv2.COLOR_BGR2GRAY)
blurred = cv2.GaussianBlur(gray, (5, 5), 0)
edged = cv2.Canny(blurred, 75, 200)
fig = plt.figure(figsize=(15, 10))
plt.subplot(1, 2, 1)
plt.imshow(cv2.cvtColor(image, cv2.COLOR_BGR2RGB))
plt.axis('off')
plt.subplot(1, 2, 2)
plt.imshow(edged,cmap ='gray')
plt.axis('off')
|
1
| (-0.5, 524.5, 699.5, -0.5)
|
检测到图片中的答题卡
1
2
3
4
5
6
7
8
9
10
11
12
13
14
15
16
|
_,cnts,_ = cv2.findContours(edged.copy(), cv2.RETR_EXTERNAL,cv2.CHAIN_APPROX_SIMPLE)
docCnt = None
if len(cnts) > 0:
cnts = sorted(cnts, key=cv2.contourArea, reverse=True)
for c in cnts:
peri = cv2.arcLength(c, True)
approx = cv2.approxPolyDP(c, 0.02 * peri, True)
if len(approx) == 4:
docCnt = approx
break
|
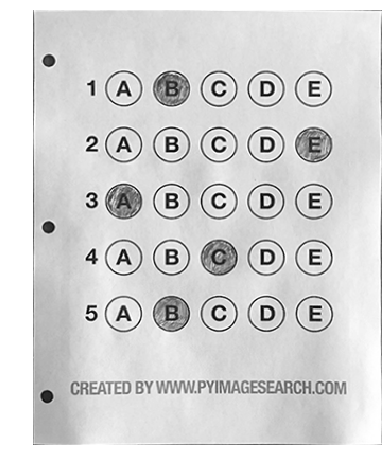
透视变换来提取答题卡
1
2
3
4
5
6
7
8
|
paper = four_point_transform(image, docCnt.reshape(4, 2))
warped = four_point_transform(gray, docCnt.reshape(4, 2))
fig = plt.figure(figsize=(8, 8))
plt.imshow(warped,cmap ='gray')
plt.axis('off')
|
提取气泡/圆点
1
2
3
4
5
6
7
8
9
10
11
12
13
|
thresh = cv2.threshold(warped, 0, 255, cv2.THRESH_BINARY_INV | cv2.THRESH_OTSU)[1]
_,cnts,_ = cv2.findContours(thresh.copy(), cv2.RETR_EXTERNAL, cv2.CHAIN_APPROX_SIMPLE)
questionCnts = []
for c in cnts:
(x, y, w, h) = cv2.boundingRect(c)
ar = w / float(h)
if w >= 20 and h >= 20 and ar >= 0.9 and ar <= 1.1:
questionCnts.append(c)
|
答案判断部分
构建答案字典
1
2
|
ANSWER_KEY = {0: 1, 1: 4, 2: 0, 3: 3, 4: 1}
|
气泡排序
1
2
3
|
questionCnts = sort_contours(questionCnts, method="top-to-bottom")[0]
correct = 0
|
循环判断
1
2
3
4
5
6
7
8
9
10
11
12
13
14
15
16
17
18
19
20
21
22
23
24
25
26
27
28
29
30
31
32
33
34
35
|
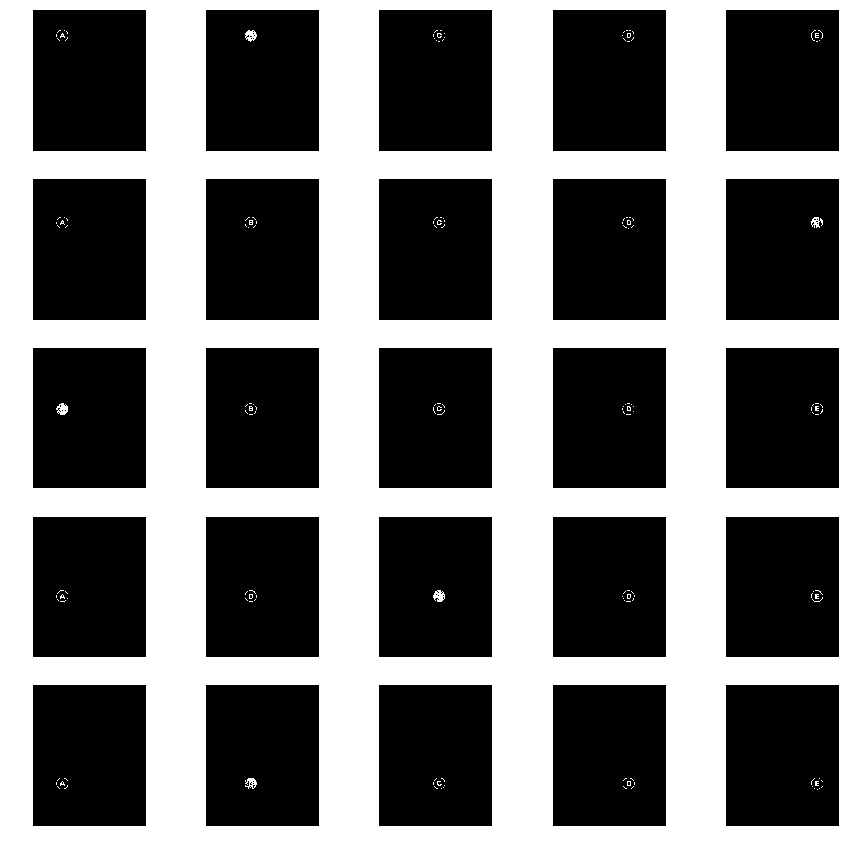
fig = plt.figure(figsize=(15,15))
n = 1
for (q, i) in enumerate(np.arange(0, len(questionCnts), 5)):
cnts = sort_contours(questionCnts[i:i + 5])[0]
bubbled = None
for (j, c) in enumerate(cnts):
mask = np.zeros(thresh.shape, dtype="uint8")
cv2.drawContours(mask, [c], -1, 255, -1)
mask = cv2.bitwise_and(thresh, thresh, mask=mask)
total = cv2.countNonZero(mask)
plt.subplot(5, 5, n)
plt.axis('off')
n += 1
plt.imshow(mask,cmap ='gray')
if bubbled is None or total > bubbled[0]:
bubbled = (total, j)
color = (0, 0, 255)
k = ANSWER_KEY[q]
if k == bubbled[1]:
color = (0, 255, 0)
correct += 1
cv2.drawContours(paper, [cnts[k]], -1, color, 3)
|
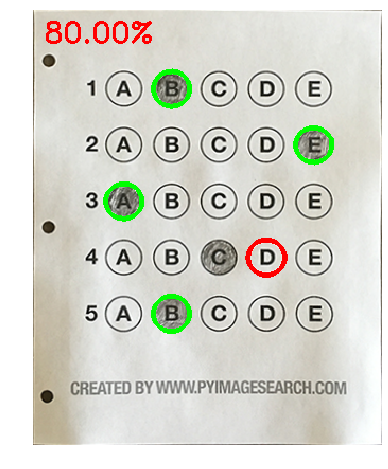
计算分数并打分
1
2
3
4
5
6
7
8
9
10
|
score = (correct / 5.0) * 100
print("[INFO] score: {:.2f}%".format(score))
cv2.putText(paper, "{:.2f}%".format(score), (10, 30), cv2.FONT_HERSHEY_SIMPLEX, 0.9, (0, 0, 255), 2)
fig = plt.figure(figsize=(8, 8))
plt.imshow(cv2.cvtColor(paper, cv2.COLOR_BGR2RGB))
plt.axis('off')
|